Esta función incluye otros parámetros que pueden resultar muy interesantes en determinadas situaciones. Repasemos algunos:
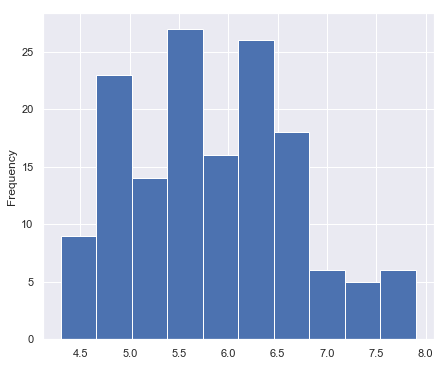
- figsize: tupla que determina el tamaño de la figura en pulgadas:
iris.sepal_length.plot(kind = "hist", figsize = (7, 6));

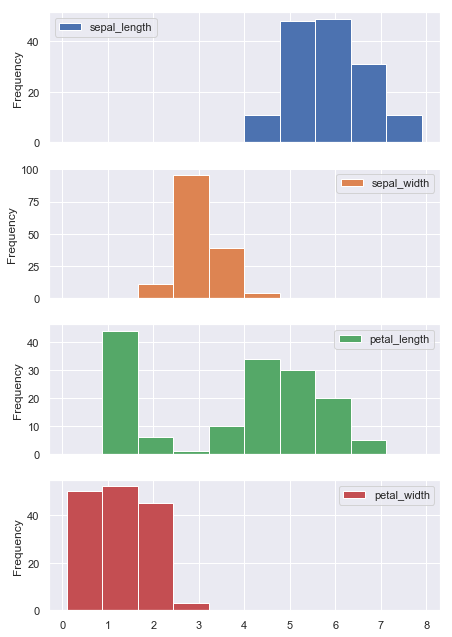
- subplots: booleano (que toma por defecto el valor False). Determina si hay que crear diferentes gráficas para cada columna:
iris.plot(kind = "hist", figsize = (7, 11), subplots = True);

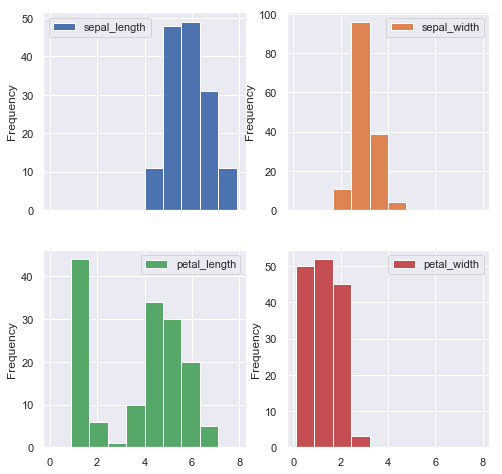
- layout: tupla indicando en cuántas filas y columnas deberán mostrarse las gráficas:
iris.plot(kind = "hist", subplots = True, figsize = (8, 8), layout = (2, 2));

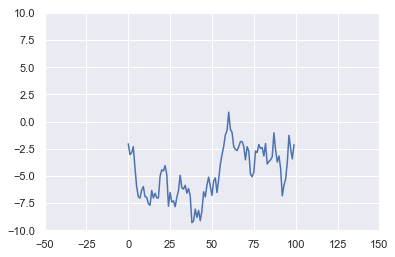
- xlim, ylim: tuplas indicando los límites a aplicar a los ejes x e y respectivamente:
s = pd.Series(np.random.randn(100).cumsum())
s.plot(xlim = (-50, 150), ylim = (-10, 10));
