Full name
statistics.pvariance
Library
statistics
Syntax
statistics.pvariance(data, mu = None)
Description
The statistics.pvariance function returns the variance of the population made up of the elements in data.
Parameters
- data: Iterable for whose elements you want to obtain the variance.
- mu: Optional argument. Value from which deviations are calculated. If omitted, they are obtained with respect to the mean value of the data.
Result
The statistics.pvariance function returns a real number.
Examples
We can obtain the variance of the values of a list with the following code:
statistics.pvariance([1, 3, 3, 6])
3.1875
In this second example we are going to generate a list made up of a thousand random values extracted from a Gaussian distribution with mean 5 and standard deviation 1:
import random
y = [random.gauss(5, 1) for _ in range(1000)]
Let's show the histogram:
import matplotlib.pyplot as plt
plt.figure(figsize = (8, 4))
plt.hist(y, bins = 10)
plt.grid()
plt.show()
plt.hist(y, bins = 10)
plt.grid()
plt.show()
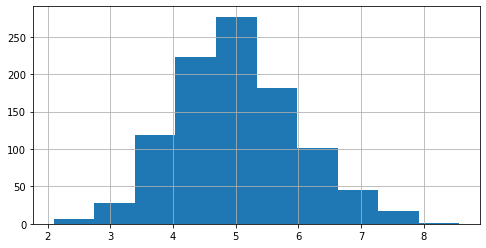
Let's obtain its variance below:
statistics.pvariance(y)
0.9660428034554145
If we specify the value 10 as mu argument, the deviations will be calculated with respect to this value:
statistics.pvariance(y, mu = 10)
25.787866583509008