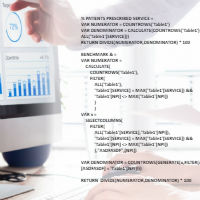
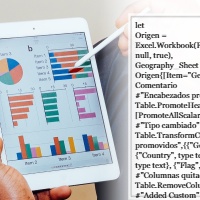
Power BI has established itself, in just a few years, as the market leader for Business Intelligence self-service tools. In this course, the concepts involved in the use of this powerful tool will be reviewed, from data loading and transformation (ETL processes), creation of visualizations, introduction to the use of the DAX data modeling language for the creation of custom columns and measures that shape the metrics of interest, and ending with the upload of our reports to the Power BI Service, the creation of dashboards and their sharing.
Courses
Courses for companies and educational institutions (universities, business schools...). The recommended duration and the most common contents are indicated in each case, all of which are customizable to adapt them to the needs of each case.
More information about each available course by clicking on its name.
The DAX data modeling language developed by Microsoft is probably the biggest difference between Power BI and the rest of the competitors in the Business Intelligence industry. DAX is a library of functions and operators that can be combined for data modeling in Power BI, Azure Analysis Services, SQL Server Analysis Services (SSAS) and Power Pivot for Excel.
The exploitation of the data requires the definition of transformation processes that ensure its quality, both from the point of view of Business Intelligence and from the point of view of predictive analysis -application of Machine Learning algorithms-. Power BI, the market leader in self-service BI tools, implements a language -the M language- for the definition of these processes. M is a functional language, not particularly complex but very powerful, that is often unknown or underused by Power BI users.
For decades, information systems have been key elements to ensure the competitiveness of a company. Gone, therefore, are those times when it was not even necessary to know your customer, or the times when marketing could be a differentiator. Today, competition between companies is such that it is necessary to go a step further and use more advanced techniques that allow us to know the market in which we operate and make appropriate decisions.
Regardless of the type of analysis we carry out -exploratory or predictive-, the correct visualization of the data to be analyzed, the intermediate results we generate and the conclusions we reach are a critical part of the process.
Although there are several programming languages available for the so-called Data Science (R, Julia, Scala, Java, MATLAB...), Python has established itself as the main option due to several factors, among which are its simplicity, availability of libraries, support from the developer community, etc. In this course we will review the main characteristics of Python, its syntax, data types, control structures, built-in functions...
The concept of data mining refers to the process of discovering the facts and relationships contained in a data set. Machine learning algorithms, as part of what is known as Artificial Intelligence (AI), aim to analyze these data sets to be able to be later applied in predictions or classifications, just to mention a couple of examples.
Natural Language Processing (NLP) is an area of research within the field of Artificial Intelligence that has objectives that involve tasks ranging from the conversion of speech into text, to its processing and the generation of speech from it. The applications of this type of analysis are numerous: text classification, sentiment analysis or generation of automatic summaries, to name a few.
Time series are used in a multitude of areas, being increasingly frequent that the generation of data is accompanied by a time stamp. For example, the output of a sensor that measures the temperature of an engine is recorded together with information about the date and time of generation of the data, allowing us to apply specialized techniques that predict engine breakdown or a decrease in performance before it occurs.
Tableau has consistently been one of the market leaders for self-service Business Intelligence tools, being, today, the only solution capable of keeping pace with the development of Power BI, a reference in this market. In this introductory course we will learn to connect to our data, to transform it properly in order to generate visual objects, we will know the visual analysis tools available -tools far above those offered by its competitors-, how to create dashboards and stories, etc.
The correct exploitation of the data goes through its cleaning and prior transformation by processes called ETL (Extract-Transform-Load) which, due to their importance, represent a significant percentage of the development time of a report. Tableau Prep builder allows connection to our data sources and the creation of versatile "flows" that determine the transformations to be applied to the data.
