statistics.variance(data, xbar=None)
The statistics.variance function returns the variance of the sample made up of the elements in data.
- data: Iterable for whose elements you want to obtain the variance.
- xbar: Optional argument. Value from which deviations are calculated. If omitted, they are obtained with respect to the mean value of the data.
The statistics.variance function returns a value of type float.
We can obtain the variance of the values of a list with the following code:
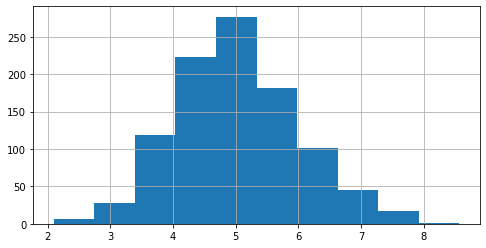
In this second example we are going to generate a list made up of a thousand random values extracted from a Gaussian distribution with mean 5 and standard deviation 1:
Let's show the histogram:
plt.hist(y, bins = 10)
plt.grid()
plt.show()

Let's obtain its variance below:
If we specify as argument xbar the value 10, the deviations will be calculated with respect to this value: