A common scenario is one in which we want to evaluate the accumulated total, including all data up to a certain date and not just those involved in the current filter context. For example, if we assume the existence of a sales table Sales that contains an Amount column with the sales figure, we could define a measure that calculates the sum of this column with the following DAX expression:
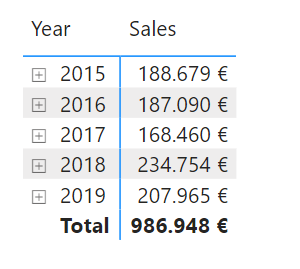
Obviously, this measure will adapt to the filter context, so if we take it to a matrix in which sales are broken down by year:

...we see that, for each year, the displayed sales figure includes only the sales for that year.
What we would like is for, in each evaluation of the measure, the time period considered to start on the first day there were sales (assume January 1, 2015) and extend to the last date of the "current period". For example, in the figure for the year 2018, the current period is the corresponding 365 days of that year. Well, for the accumulation calculation for that year we would want the period between January 1, 2015 and December 31, 2018 to be considered. That is, written in pseudo-code:
CALCULATE(
[Sales],
Period between the first available date and the last date of the current context
)
The period in question can be calculated using the DATESBETWEEN function that returns the set of dates between two given ones. If the calendar is contained in the Calendar table, we would therefore have to code the following measure:
Accumulated sales =
CALCULATE(
[Sales],
DATESBETWEEN(
'Calendar'[Date],
First available date,
Last date of current context
)
)
Now, it is the calculation of those two dates that is most complex, as we want the first date ("First available date") to be absolute and refer to the first available date in the calendar, while we want the second ("Last date of current context") to adapt to the context.
To obtain the first available date in the calendar we must ensure that no filters are being applied to it, for which we can use the ALL function (which will return a table). And to extract the first available date from this table we cannot use the MIN function as it requires a column as an argument, so we will have to use the FIRSTDATE function, which does accept a table as an argument and returns another table (with the oldest available date), which we can pass to the CALCULATE function as a filter argument:
For the calculation of the last date of the current context we just have to use the MAX function, passing as an argument the column with calendar information that our visual object is breaking down: the 'Calendar'[Date] column. That is, the last date of the current context would be given by:
That is, the expression
'Calendar'[Date],
FIRSTDATE(ALL(Sales[Order Date])),
MAX('Calendar'[Date])
)
...will return the set of dates in the calendar between the oldest available and the last involved in the current context. We can now define the "Accumulated sales" measure as:
CALCULATE(
[Sales],
DATESBETWEEN(
'Calendar'[Date],
FIRSTDATE(ALL(Sales[Order Date])),
MAX('Calendar'[Date])
)
)
If we wanted to use variables to make the code more legible, we could create two variables, __firstdate and __lastDate containing the two dates involved in the previous code:
VAR __firstDate = FIRSTDATE(ALL(Sales[Order Date]))
VAR __lastDate = MAX('Calendar'[Date])
RETURN
CALCULATE(
[Sales],
DATESBETWEEN(
'Calendar'[Date],
__firstDate,
__lastDate
)
)
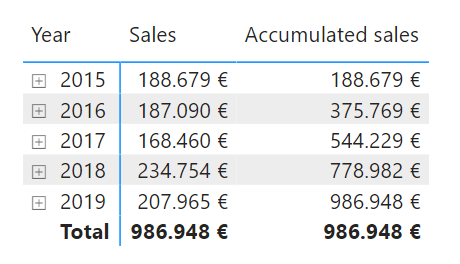
Now, if we take the previous measure to our matrix, we verify that the sales are being accumulated as we wanted:

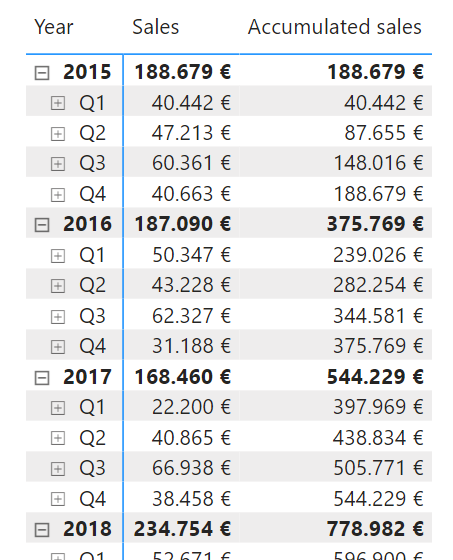
And, of course, if we show the matrix broken down by any other level of our calendar hierarchy, by quarters, for example, the calculation of accumulated sales is still being done correctly:
