pandas.crosstab(
index,
columns,
values = None,
rownames = None,
colnames = None,
aggfunc = None,
margins = False,
margins_name = 'All',
dropna = True,
normalize = False
)
The pandas.crosstab function returns the contingency table resulting from crossing two or more fields in a dataframe. Although, by default, the result evaluates the frequencies (absolute or relative) of each combination of values, it is possible to specify an aggregation function.
- index: Variable type array, pandas series or list of arrays/series, values according to which to disaggregate the rows.
- columns: Variable type array, pandas series or list of arrays/series, values according to which to disaggregate the columns.
- values: Values to apply the aggregation functions indicated by the aggfunc parameter.
- rownames: Sequence. Names to give to the levels of the row index of the result.
- colnames: Sequence. Names to give to the levels of the result column index.
- aggfunc: Function or sequence of functions. Aggregation functions to apply to the values given by the values parameter for each identified combination of rows and columns.
- margins: Boolean. If it takes the value True, the resulting table will include subtotals.
- margins_name: String. Name to give to the row or column that will contain the subtotals. By default the name "All" is applied.
- dropna: Boolean. If it takes the value True, the result will not consider the columns whose values are all NaN.
- normalize: Boolean, string, or integer. Depending on the value that this parameter takes, instead of a table of absolute frequencies, the result will include a table of relative frequencies calculated with respect to the total, the subtotal of rows or the subtotal of columns. Specifically:
- If this parameter takes the value "all" or True, the normalization will be carried out with respect to the total number of samples.
- If it takes the value "index" or 0, the normalization will be carried out with respect to the subtotal corresponding to each row.
- If it takes the value "columns" or 1, the normalization will be carried out with respect to the subtotal corresponding to each column.
- If it takes the value False (default value), the result of the function will not be normalized.
The pandas.crosstab function returns a pandas dataframe.
Let's start from the dataset tips provided by the seaborn library:
import pandas as pd
import seaborn as sns
tips = sns.load_dataset("tips")
tips.head()

This dataset includes 244 samples:
tips.shape
(244, 7)
We could find out the distribution of samples resulting from crossing the "sex" and "smoker" fields with the following instruction:
pd.crosstab(tips.sex, tips.smoker)
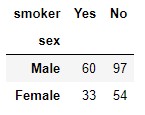
We observe that the 244 samples are distributed as follows:
- 60 male smokers
- 97 non-smoking men
- 33 women smokers
- 54 non-smoking women
crosstab & groupby
Note that we could have obtained the same result by applying the pandas.DataFrame.groupby function. We start by grouping the tips table according to the values of the "sex" and "smoker" fields and applying the count function as an aggregation function:
tips.groupby(["sex", "smoker"])["tip"].count()
sex smoker
Male Yes 60
No 97
Female Yes 33
No 54
Name: tip, dtype: int64
...and apply the pandas.DataFrame.unstack method:
tips.groupby(["sex", "smoker"])["tip"].count().unstack()
crosstab & pivot_table
We could have also obtained the same result using the pandas.DataFrame.pivot_table function (functionality also available as a method), applying as an aggregation function the "length" of the data block corresponding to one of the two fields involved:
tips.pivot_table(index = "sex", columns = "smoker", aggfunc = {"sex": len})
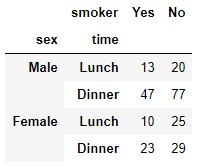
Row and column disaggregation can be done according to more than one variable. For example:
pd.crosstab([tips.sex, tips.time], tips.smoker)
Margins and margins_name parameters
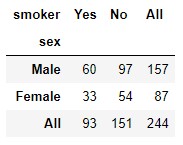
The use of the margins parameter allows us to add subtotals of rows and columns (it is not possible to show subtotals only in a single dimension):
pd.crosstab(tips.sex, tips.smoker, margins = True)
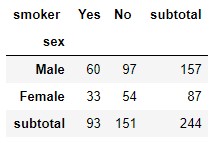
The name of the row/column with the subtotal can be set using the margins_name parameter:
pd.crosstab(tips.sex, tips.smoker, margins = True, margins_name = "subtotal")
Normalize parameter
Instead of showing the absolute frequencies of each combination, we can "normalize" those frequencies with respect to the total or with respect to the subtotals of rows or columns. For example, if we assign the normalize parameter the value True, the normalization is performed with respect to the total of samples:
pd.crosstab(tips.sex, tips.smoker, normalize = True)
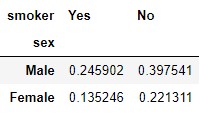
In the previous result, we verified that, rounding off, 24.5% of the samples correspond to male smokers, 39.7% to non-smoking men, 13.5% to female smokers, and 22.1% to non-smoking women. Of course, the sum of these four percentages is 100%.
If we want the normalization to be carried out according to the subtotal of rows -for example-, we could achieve it with the following code:
pd.crosstab(tips.sex, tips.smoker, normalize = "index")

In this result we see that 100% of men are divided into 38.2% who smoke and 61.7% who do not smoke. And that 100% of women are divided into 37.9% who smoke and 62.0% who do not.
Rownames and colnames parameters
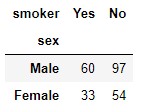
These parameters are used to name the indexes. For example, if we are crossing the "sex" and "smoker" fields as in the previous examples, the row and column indexes are given the same names:
pd.crosstab(tips.sex, tips.smoker)
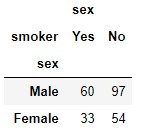
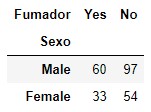
But we could change them using the parameters in question:
pd.crosstab(
tips.sex,
tips.smoker,
rownames = ["Sexo"],
colnames = ["Fumador"]
)
If we are crossing more than two fields (including the result a multilevel index), the number of names must match the number of levels in each index. For example:
pd.crosstab(
[tips.sex, tips.time],
tips.smoker,
rownames = ["Sexo", "Tipo"],
colnames = ["Fumador"]
)

Aggfunc and values parameters
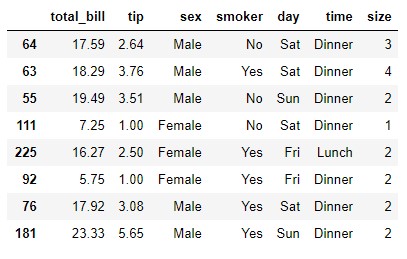
All the examples seen so far disaggregated the fields that were taken to rows and columns and their frequency (absolute or relative) was counted. Let's take a very simple example: let's take a set of 8 random samples extracted from the tips dataset to the variable t:
t = tips.sample(8, random_state = 0)
t
Now let's get the contingency table by crossing the sex and smoker fields:
pd.crosstab(t.sex, t.smoker)
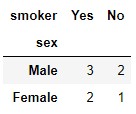
We already know that what we are doing is grouping the samples according to the criteria defined by the combination of the values of the two fields. For example, in the previous result we see that there are three male smokers, two male non-smokers, two female smokers and one female non-smoker.
However, once our data has been disaggregated into these four blocks, we might be interested in applying one or more aggregation functions to additional fields in the dataset. For example, we might want to calculate the average value of tips (tip field) for these customer blocks.
Well, this is exactly what the aggfunc and values parameters allow us: the first allows us to indicate the aggregation function or functions to apply and, the second, the data to apply them to. The mentioned average value of tips could be obtained with the following code:
pd.crosstab(t.sex, t.smoker, aggfunc = "mean", values = t.tip)
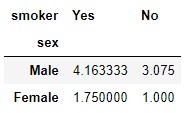
Let's confirm that the calculation is correct: we saw that there are three male smokers. If we review the dataset t we see that the tips left by these customers take the values 3.76, 3.08 and 5.65:
t.loc[(t.sex == "Male") & (t.smoker == "Yes")]
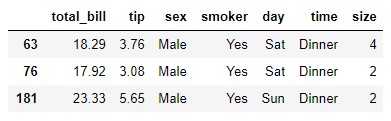
The average of these three values is 4.1633, which is the value that appears as a result of our contingency table.
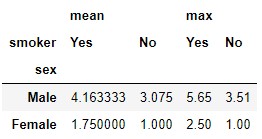
We can apply more than one aggregation function. For example, we might be interested in the average value and the maximum value of tips for each of these four groups of customers:
pd.crosstab(t.sex, t.smoker, aggfunc = ["mean", "max"], values = t.tip)