The ROLLUP function identifies a subset of the table's fields being aggregated by the SUMMARIZE function, fields for which subtotals will be generated.
ROLLUP(
groupBy_columnName
[, groupBy_columnName]
)
- groupBy_columnName: Fully qualified name of an existing column in the table referenced in the SUMMARIZE function or in some related table. More than one field can be added.
The ROLLUP function causes the generation of one or more lines in the aggregation table with the subtotals of the groups formed by the aggregation fields excluding those added as ROLLUP arguments. See examples below.
The ROLLUP function can only be used as an argument of the SUMMARIZE function.
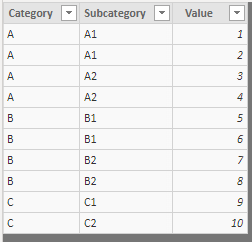
To show how this function works, we start from the following data table ("Data"):
Next, we create an aggregated table using the SUMMARIZE function, using the Category field as the grouping field:
Summarized table =
SUMMARIZE(
Data,
Data[Category],
"Sum", SUM(Data[Value]),
"Max", MAX(Data[Value]),
"Avg", AVERAGE(Data[Value])
)
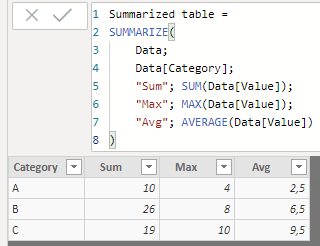
As you would expect, the fields created in this table (Sum, Max, and Avg) are calculated on the records of each of the categories.
Now we create a similar table, but specifying that the Category field is a "rollup" field:
Summarized table Rollup_Cat =
SUMMARIZE(
Data,
ROLLUP(Data[Category]),
"Sum", SUM(Data[Value]),
"Max", MAX(Data[Value]),
"Avg", AVERAGE(Data[Value])
)
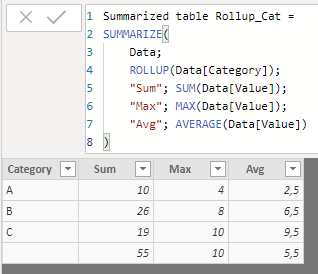
We see that a new line has been generated showing subtotals for all groups of grouping fields specified in the SUMMARIZE function except those included in the ROLLUP function (that is, for no group of fields -because the only field referenced in the SUMMARIZE function is the one included in the ROLLUP function-, which means that in the new line subtotals are calculated involving all the data from the original table).
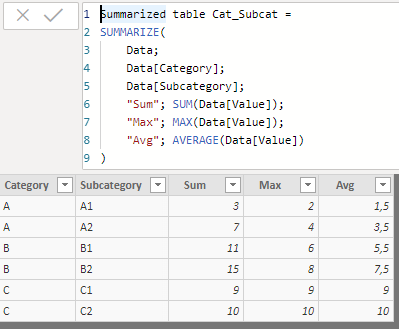
Let's now create an aggregate table using both Category and Subcategory as aggregation fields:
Summarized table Cat_Subcat =
SUMMARIZE(
Data,
Data[Category],
Data[Subcategory],
"Sum", SUM(Data[Value]),
"Max", MAX(Data[Value]),
"Avg", AVERAGE(Data[Value])
)
If we specify in this table that the Category field is a "rollup" field, the result is the following:
Summarized table Subcat_Rollup_Cat =
SUMMARIZE(
Data,
ROLLUP(Data[Category]),
Data[Subcategory],
"Sum", SUM(Data[Value]),
"Max", MAX(Data[Value]),
"Avg", AVERAGE(Data[Value])
)
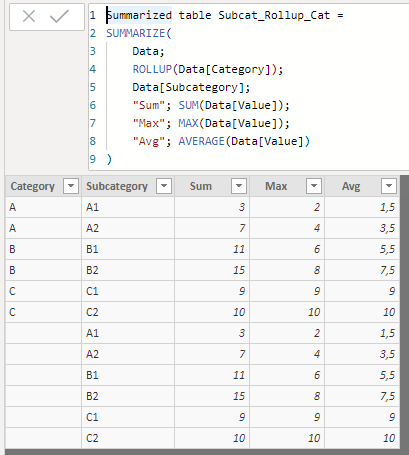
We see that the resulting aggregated table, in addition to the Sum, Max and Avg fields corresponding to the different groups of records resulting from combining the values of the Category and Subcategory fields, includes 6 new lines, with the subtotals corresponding to the groups created (combinations of the Category and Subcategory fields) excluding the Category field that has been included as an argument in the ROLLUP function, that is, with subtotals of the groups formed only by the Subcategory field. As this field can take 6 values, 6 new rows have been added.
If, on the other hand, we include the Subcategory field as an argument of the ROLLUP function:
Summarized table Cat_Rollup_Subcat =
SUMMARIZE(
Data,
Data[Category],
ROLLUP(Data[Subcategory]),
"Sum", SUM(Data[Value]),
"Max", MAX(Data[Value]),
"Avg", AVERAGE(Data[Value])
)
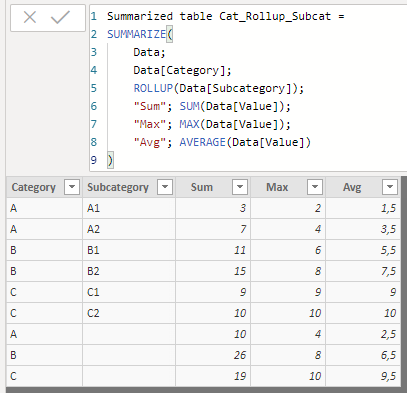
...we would see that, on this occasion, 3 new rows have been added to the aggregation table, rows corresponding to the three values that the Category field takes, subset of the fields involved in the SUMMARIZE function that are not included in the ROLLUP function.
Continuing with the same example, if we create the same aggregation table but specifying that both the Category field and the Subcategory field are of type "rollup" (and in this order), the result would be the following:
Summarized table Rollup_Cat_Subcat =
SUMMARIZE(
Data,
ROLLUP(Data[Category], Data[Subcategory]),
"Sum", SUM(Data[Value]),
"Max", MAX(Data[Value]),
"Avg", AVERAGE(Data[Value])
)
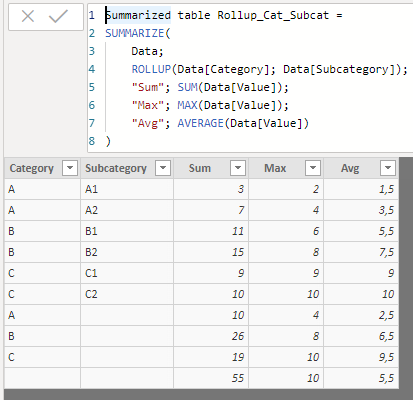
In this case, 3 rows corresponding to the field located as the rightmost argument of the ROLLUP function (Subcategory) have been included, and then an additional row considering the two fields (Category and Subcategory).
Finally, if we repeat the table but changing the order of the arguments of the ROLLUP function:
Summarized table Rollup_Subcat_Cat =
SUMMARIZE(
Data,
ROLLUP(Data[Subcategory], Data[Category]),
"Sum", SUM(Data[Value]),
"Max", MAX(Data[Value]),
"Avg", AVERAGE(Data[Value])
)
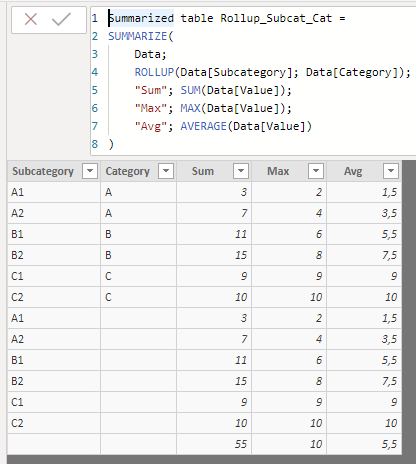
...the result is similar: 6 new rows have been created corresponding to the field located more to the right of the arguments of the ROLLUP function, and an additional line considering the two fields.