The SUMMARIZECOLUMNS function returns an aggregated table according to a set of fields, being able to apply filters to the input values.
SUMMARIZECOLUMNS(
groupBy_columnName
[, groupBy_columnName]...,
[filterTable]...,
[, name,
expression]…
)
- groupBy_columnName: Fully qualified name of an existing column in the base table to be used or in a related table to create the groups based on the values found in it. Multiple fields can be added. Each groupBy_columnName column will be cross-joined (different tables) or auto-existed (same table) with the other specified columns.
- filterTable: Expression that returns a table that will be added to the filter context of all the columns specified in the groupBy_columnName arguments. The values present in the filter table are used to apply a filter before the cross-join or auto-existed takes place.
- name: Name given to the total calculated in expression.
- expression: DAX expression that returns a scalar and that will be used to calculate the totals.
The SUMMARIZECOLUMNS function returns a table having as columns those specified in the groupBy_columnName arguments (values that will determine the aggregation criteria) and those added as name that will contain the result of evaluating expression for the combinations of the groupBy_columnName fields.
In the table that is returned as a result, only those rows are kept for which at least one of the expressions returns a result other than Blank.
The SUMMARIZECOLUMNS function does not guarantee any order in the results.
A column cannot be specified more than once as groupBy_columnName argument.
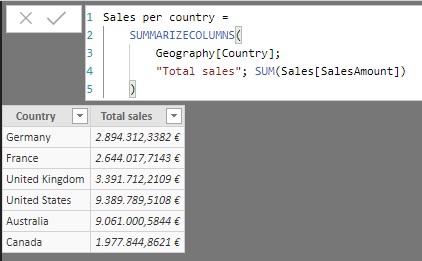
If we have a table with sales, Sales, and another with geographic information, Geography, we can create a calculated table with the summary of sales by country with the following expression:
Sales per country =
SUMMARIZECOLUMNS(
Geography[Country],
"Total sales",
SUM(Sales[SalesAmount])
)
(Country being the field that contains the countries and SalesAmount the field with the sales amounts). The result is as follows:
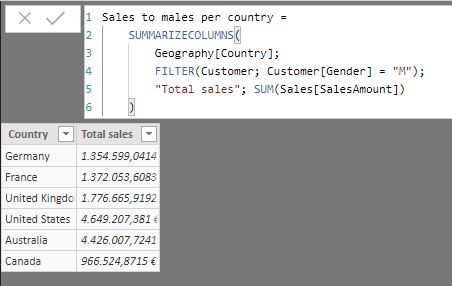
Continuing with the same example, if we have another table with customer information, Customer, we can create the same report to show sales for example only for men (information contained in the Gender field of the Customer table) with the following calculated table:
Sales to males per country =
SUMMARIZECOLUMNS(
Geography[Country],
FILTER(Customer, Customer[Gender] = "M"),
"Total sales", SUM(Sales[SalesAmount])
)