The TOPN function returns the N rows with the highest values from the indicated table.
TOPN(
n_value,
table,
orderBy_expression
[, order
[, orderBy_expression
[, order]]...]
)
- n_value: Number of rows to return as a result.
- table: Table containing the rows for which the expression will be evaluated.
- orderBy_expression: Expression to evaluate for each row of the table and whose result will be used to order the table.
- order: Optional argument. A value that specifies how to apply a rank to a value (sorting the list from bottom to top or top to bottom).
The TOPN function returns a table with the N rows with the highest values.
If the n_value argument is zero or a negative number, the function returns an empty table. Note that the rows are not included in the returned table in any specific order.
If it is the case that several rows have the same value, the function returns all of them, being able, in this particular case, to return more than the N rows requested.
If order takes the value 0 or FALSE (or if it is omitted), the table is sorted in descending order. On the other hand, if order takes the value 1 or TRUE, it is sorted in ascending order.
Since this function returns a table, it will normally be necessary to apply another aggregation function (SUMX, AVERAGEX...) to the result of this function to obtain a scalar, or use the result in functions that require a table as an argument.
In the event that more than one orderBy_expression argument is included, these will be applied successively to sort the table in the event that there are equalities in the values (see an example below).
If we have a sales table that includes the name of the product sold and the quantity sold:
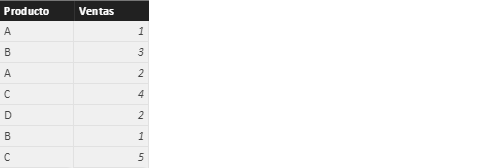
...we can define a measure that sums, for example, the sales of the 3 best-selling products. Let's start by adding a measure that sums the total sales (in the current context):
Ventas totales = SUM(Ventas[Ventas])
Now we can use the CALCULATE function to filter the previous measure so that only the 3 best-selling products are considered:
Ventas TOP 3 productos =
CALCULATE(
[Ventas totales],
TOPN(
3,
VALUES(Ventas[Producto]),
[Ventas totales]
)
)
As you can see, we are recalculating the measure [Ventas totales] with a filter: a table that returns the top 3 values of the list of all products for the measure [Ventas totales].
Note how the VALUES function is necessary to convert a column to a table (requirement in TOPN).
If we take this measure to a card-type display, we obtain the following:

...value resulting from adding the numbers 9, 4 and 3 corresponding to the products C, B and A, respectively.
Now suppose that our source data with information on sales includes the product sold, the sale price, and the cost of manufacturing and marketing it:
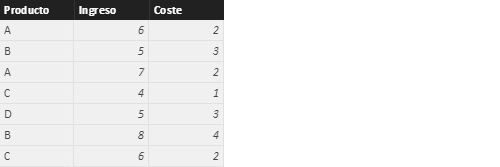
We create separate measures to calculate total revenues and costs (in the current context):
Ingresos totales = SUM(Ventas[Ingreso])
Costes totales = SUM(Ventas[Coste])
We can take the list of products with their income and total costs to a table-type display:
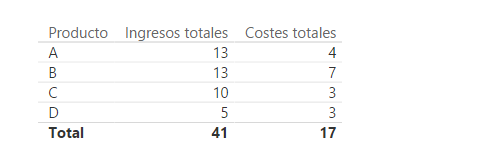
It can be seen how there are two products whose total revenues coincide in the first position of the sales ranking. In this way, if we were to create a measure to return the total costs of the 3 products with the highest income:
Costes totales = SUM(Ventas[Coste])
The result, taken to a card-like display, would be the following:

...result of adding the costs of products A, B and C (products with higher income).
However, if instead of wanting to consider the 3 products with the highest income, we would like to consider only one product (that is, if we were interested in knowing the total costs derived from selling the product with the highest income):
Costes TOP 1 producto =
CALCULATE(
[Costes totales],
TOPN(
1,
VALUES(Ventas[Producto]),
[Ingresos totales],
FALSE
)
)
...we could confirm how the result of the measurement is 11!:

This occurs because the TOPN function, in this case, returns a table with two rows, one for each of the products that occupy the first position in the income ranking.
Now imagine that it is decided that the measure Costes TOP 1 producto always considers the highest cost (in the case of equal income). We can we can meet this requirement by adding a new orderBy_expression argument:
Costes TOP 1 producto =
CALCULATE(
[Costes totales],
TOPN(
1,
VALUES(Ventas[Producto]),
[Ingresos totales],
FALSE,
[Costes totales],
FALSE
)
)
We are now instructing the TOPN function to extract the product with the highest total revenue and, if equal, to consider the total costs also in a decreasing direction (hence the FALSE argument after [Costes totales]). Our visualization now shows the following: