The ROLLUPADDISSUBTOTAL function identifies a set of columns specified in the SUMMARIZECOLUMNS function for which that function should compute subtotals.
ROLLUPADDISSUBTOTAL(
<groupBy_columnName>,
<isSubtotal_columnName>,
<filter>
[, <groupBy_columnName>, <isSubtotal_columnName>, <filter>]
)
- groupBy_columnName: Fully qualified name of an existing column that will be used to create groups based on the values found in it. It cannot be an expression.
- isSubtotal_columnName: Name of the column to add that will contain Booleans indicating whether or not the row is the result of calculating a subtotal.
- filter: Expression that returns a table to be added to the filter context.
The ROLLUPADDISSUBTOTAL function does not return any value.
The ROLLUPADDISSUBTOTAL function is used exclusively as an argument to the SUMMARIZECOLUMNS function.
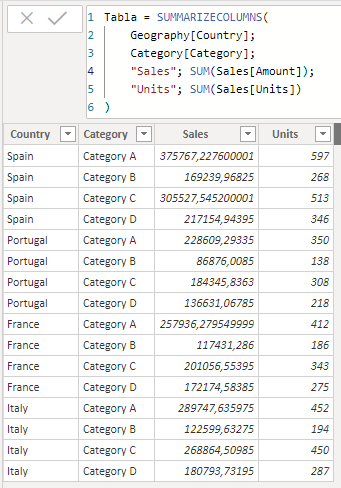
If we start from a data model with tables for sales (Sales), product categories (Category) and geographical locations (Geography), we could create a calculated table with the aggregated values of the sales figure and number of units sold by country and category with the following code:
Tabla = SUMMARIZECOLUMNS(
Geography[Country],
Category[Category],
"Sales", SUM(Sales[Amount]),
"Units", SUM(Sales[Units])
)

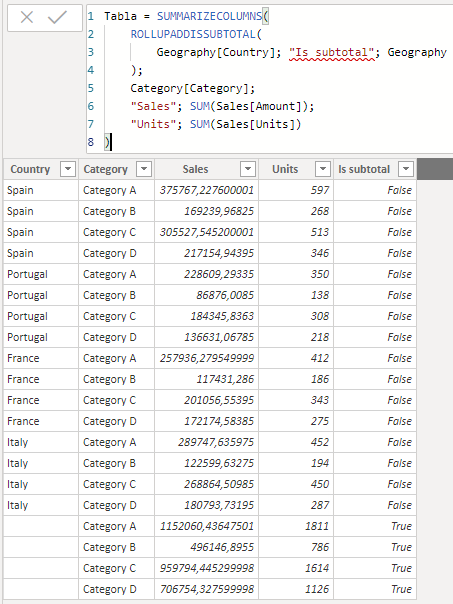
We can calculate subtotals for the field relative to the category with the following code:
Tabla = SUMMARIZECOLUMNS(
ROLLUPADDISSUBTOTAL(
Geography[Country], "Is subtotal", Geography
),
Category[Category],
"Sales", SUM(Sales[Amount]),
"Units", SUM(Sales[Units])
)

Note that the entire Geography table has been passed to the function as a filter.