The SUMMARIZE function returns a table aggregated based on a set of fields.
SUMMARIZE(
table,
[, groupBy_columnName]…
[, ROLLUP(groupBy_columnName [, groupBy_columnName]...)]
[, name, expression]…
)
- table: Reference to a table or DAX expression that returns a table.
- groupBy_columnName: Optional argument. Fully qualified name of an existing column in table or in some related table to create the groups based on the values found in it. More than one field can be added.
- name: Name given to the column that will contain the total calculated in expression.
- expression: DAX expression that returns a scalar and that will determine the values of the name column.
The SUMMARIZE function returns a table having as columns those specified in the groupBy_columnName argument (values that will specify the aggregation criteria) and those added as name arguments that will contain the result of evaluating expression for the combinations of the groupBy_columnName fields. In the case of adding fields in the ROLLUP block, the table will also include partial totals for the indicated columns.
Although SUMMARIZE allows for the creation of calculated columns to be added to those resulting from cross-referencing those specified by groupBy_columnName, this approach is considered a bad practice, and it is more appropriate to use the SUMMARIZECOLUMNS function or the combination of the ADDCOLUMNS/SUMMARIZE functions for this purpose. On the other hand, the use of SUMMARIZE is more recommended when you want to obtain a table containing all possible combinations of the values of two columns.
Each column that we add as name must be accompanied by the expression that defines it. Otherwise the function will return an error.
The groupBy_columnName fields must either belong to table or to a related table.
Column names added as name arguments must be enclosed in double quotes.
Fields added as arguments of ROLLUP cannot also appear as SUMMARIZE arguments (that is, a column name can only appear once in the formula).
The number of rows in the table will be determined by the number of different values that the groupBy_columnName fields take. If, for example, only one field is included that takes 4 different values, the result will be a table with 4 rows. If two fields are included that take, respectively, 3 and 4 different values, the result will be a table with 4 x 3 = 12 rows (one for each combination of the values of both fields). From this number of rows it will be necessary to deduct those for which there is no data (rows that, by default, are hidden). If, in addition, subtotals of any field are added, the number of rows will increase.
The groupBy_columnName argument is optional. If not indicated, the function will add the entire table creating the fields indicated in name.
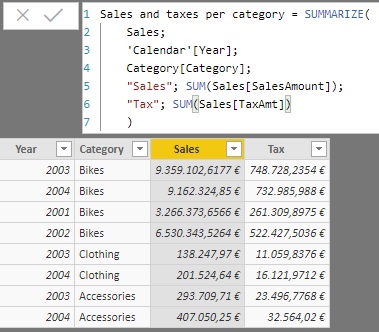
In this example we start from a table containing the sales (Sales), a table with the calendar (Calendar) and another with the list of categories to which the sold products belong (Category). The goal is to create a calculated table that shows, for each year and for each category, the total sales and the total taxes paid (SalesAmount and TaxAmt fields of the Sales table, respectively).
For this purpose, we specify as arguments to the SUMMARIZE function the table to be added (Sales) and the fields whose values will define the aggregation criteria ('Calendar'[Year] and Category[Category]). Finally, we specify, in pairs, the name of the new column and the expression to obtain (in this case the sum of the SalesAmount and TaxAmt fields):
Sales and taxes per category = SUMMARIZE(
Sales,
'Calendar'[Year],
Category[Category],
"Sales", SUM(Sales[SalesAmount]),
"Tax", SUM(Sales[TaxAmt])
)
The result is as follows:
Continuing with the same example, if we add the ROLLUP argument referring to the Category[Category] field:
Sales and taxes per category Roll up = SUMMARIZE(
Sales,
'Calendar'[Year],
ROLLUP(Category[Category]),
"Sales", SUM(Sales[SalesAmount]),
"Tax", SUM(Sales[TaxAmt])
)
...the result is as follows:
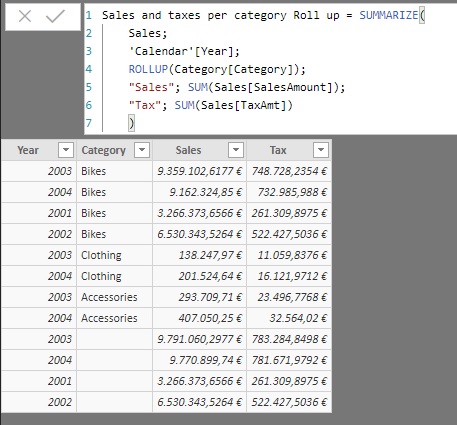
Notice how the subtotals of the Category[Category] field have been added.
If, on the contrary, we add the field 'Calendar'[Year] as an argument of ROLLUP:
Sales and taxes per category Roll up = SUMMARIZE(
Sales,
ROLLUP('Calendar'[Year]),
Category[Category],
"Sales", SUM(Sales[SalesAmount]),
"Tax", SUM(Sales[TaxAmt])
)
...the result is as follows:
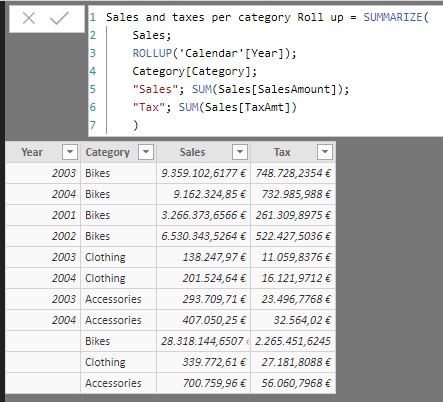
In this case, subtotals have been added for the 'Calendar'[Year] field.
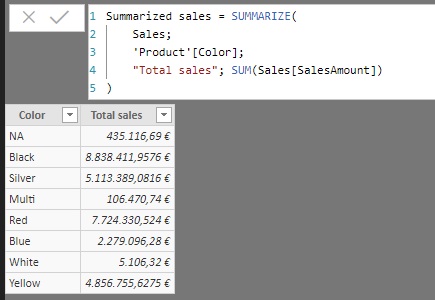
In this example we start from a sales table, Sales, and a table with information about the products for sale, Product, and we want to generate an aggregated table from Sales that shows the partial sales for each color of the available products, information contained in the column 'Product'[Color].
Assuming that there is a relationship between both tables, we can create the following measure:
Summarized sales = SUMMARIZE(
Sales,
'Product'[Color],
"Total sales", SUM(Sales[SalesAmount])
)
In it, we are using the aforementioned 'Product'[Color] field as the grouping field, and generating a column called Total sales with the sum (contextualized) of the sales amounts. The result is as shown below: